
Asset Allocation Glide Path Calculator
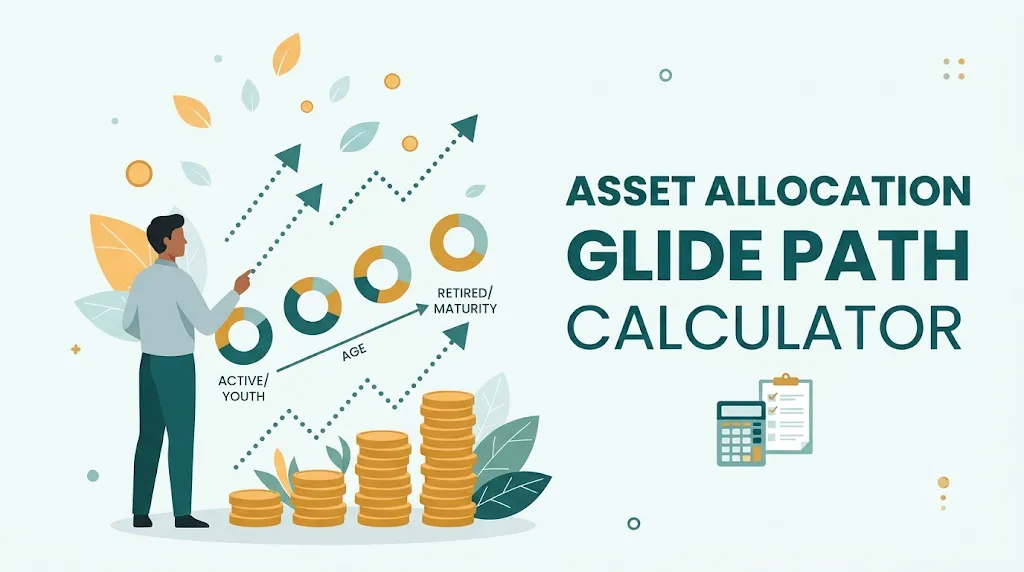
Use this free asset allocation glide path calculator to see how gradually moving from equity to safer investments as a goal nears can change the risk you carry. Enter your ages, today’s equity share and the share you want near the goal, your portfolio value and SIP, and the returns you assume. The calculator shows the year-by-year mix and compares the glide path with keeping one mix throughout.
How this asset allocation glide path works
A glide path is a plan for lowering your equity share as you approach the date you need the money. The calculator moves the equity share in a straight line (or later, if you choose) from today’s figure to the figure you want near the goal, and assumes your portfolio is brought back to that mix every year. Each year’s return is a blend of the equity and debt returns you enter, and your SIP is added every month. For example, a 35-year-old with ₹10 lakh and a ₹15,000 monthly SIP, moving from 80% equity to 30% by age 60, with 12% assumed on equity and 7% on debt, would reach about ₹2.96 crore. Keeping 80% in equity throughout would give about ₹3.93 crore, and holding 30% throughout about ₹2.39 crore. The result is an illustration, not a forecast.
What the comparison shows
In this example the glide path ends with less than the portfolio that stayed in equity, because it gives up some expected growth. What it buys is a smaller fall near the goal. If equity fell 30% just before age 60, the glide path would lose about 9% of the portfolio (about ₹26.7 lakh), against about 24% (about ₹94.3 lakh) for the portfolio that kept 80% in equity. Whether the trade is worth making depends on how soon you need the money and how much a large fall would disturb your plans.
When a glide path matters
A glide path matters most for goals with a fixed date, such as a child’s education or retirement, because there is less time to recover from a fall as the date draws near. It matters less for money you will not need for decades.
What this calculator does not include
Taxes, exit loads and other costs are not included, including the tax effect of moving money from equity to debt. Returns are steady assumptions, while real returns are uneven, and falls can be larger than 30%. The calculator assumes the mix is restored every year at no cost. Please treat the result as an illustration to discuss, not a recommendation.
Frequently asked questions
What is a glide path?
It is a schedule that lowers the share of equity in a portfolio as a goal date approaches, and raises the share of safer investments, so that a fall close to the goal does less damage.
How much equity should I have near my goal?
There is no single answer. It depends on how soon you need the money, how much a fall would affect your plans, and how you would react. Our Risk Profile Questionnaire can help you think about this, and we can talk it through with you.
Is the return shown guaranteed?
No. Mutual fund returns are market-linked and can be higher or lower than the rates you enter. Mutual fund investments are subject to market risks. Read all scheme related documents carefully. Learn more on the AMFI investor awareness site.
How do I move from equity to debt?
Gradually, by directing new investments towards debt, or by switching units. Switching can have tax and exit load consequences, so please check before you switch. Our Portfolio Rebalancing calculator shows how far your mix has drifted and what a rebalance would involve.
Is my information saved?
The calculations run in your browser. The figures you enter are not sent to us or stored unless you choose to send them, for example by using the WhatsApp button.